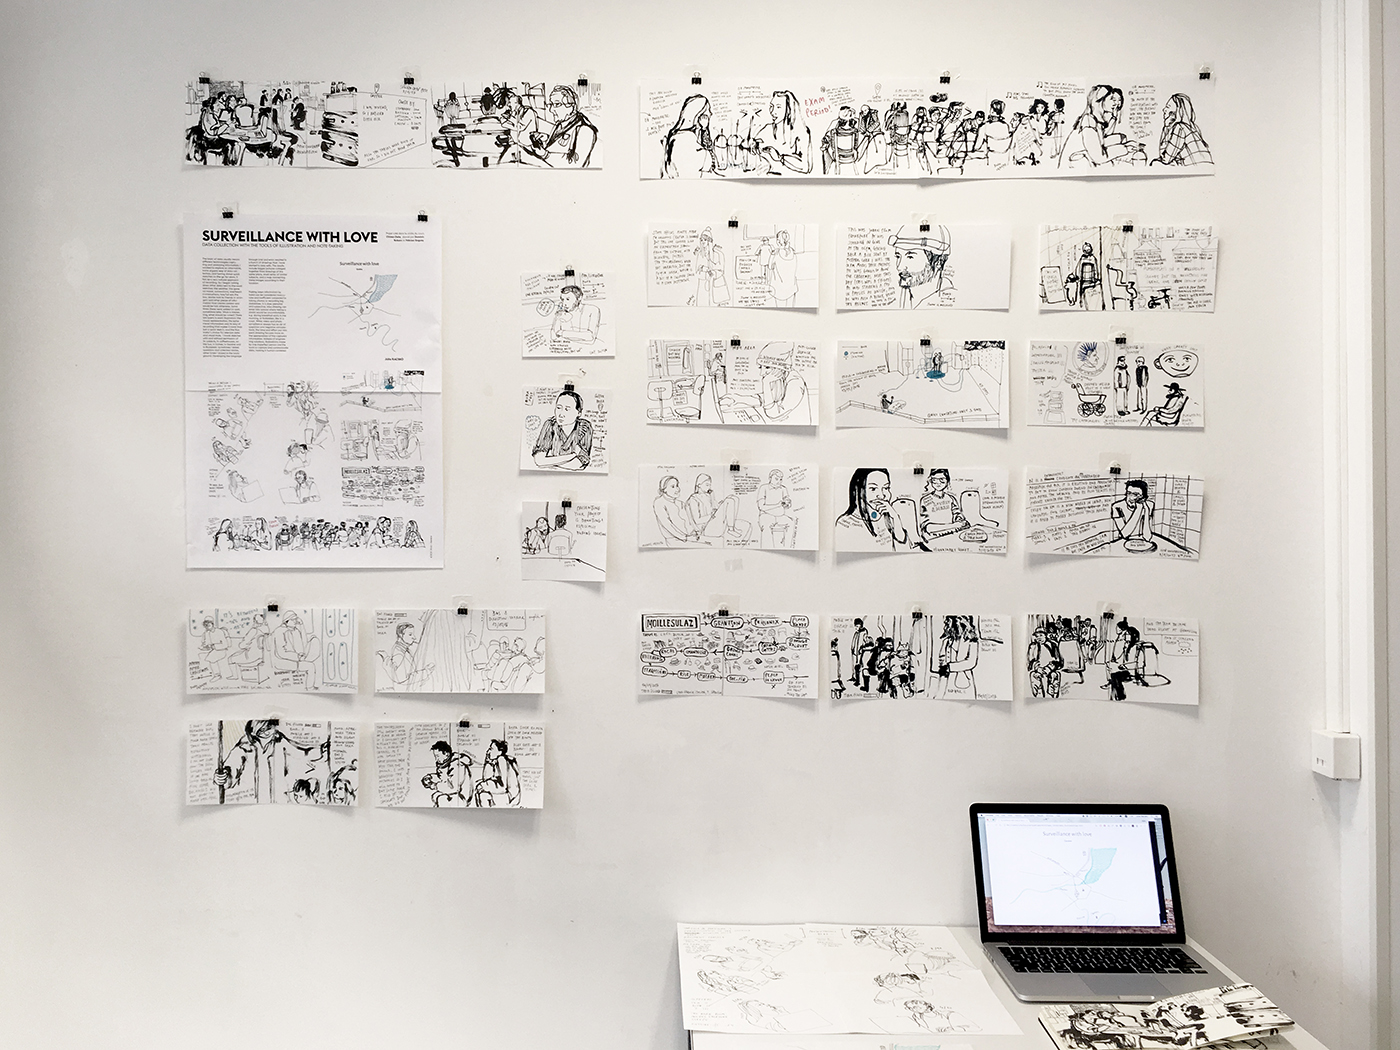
Surveillance with love
Data collection with visual note-taking
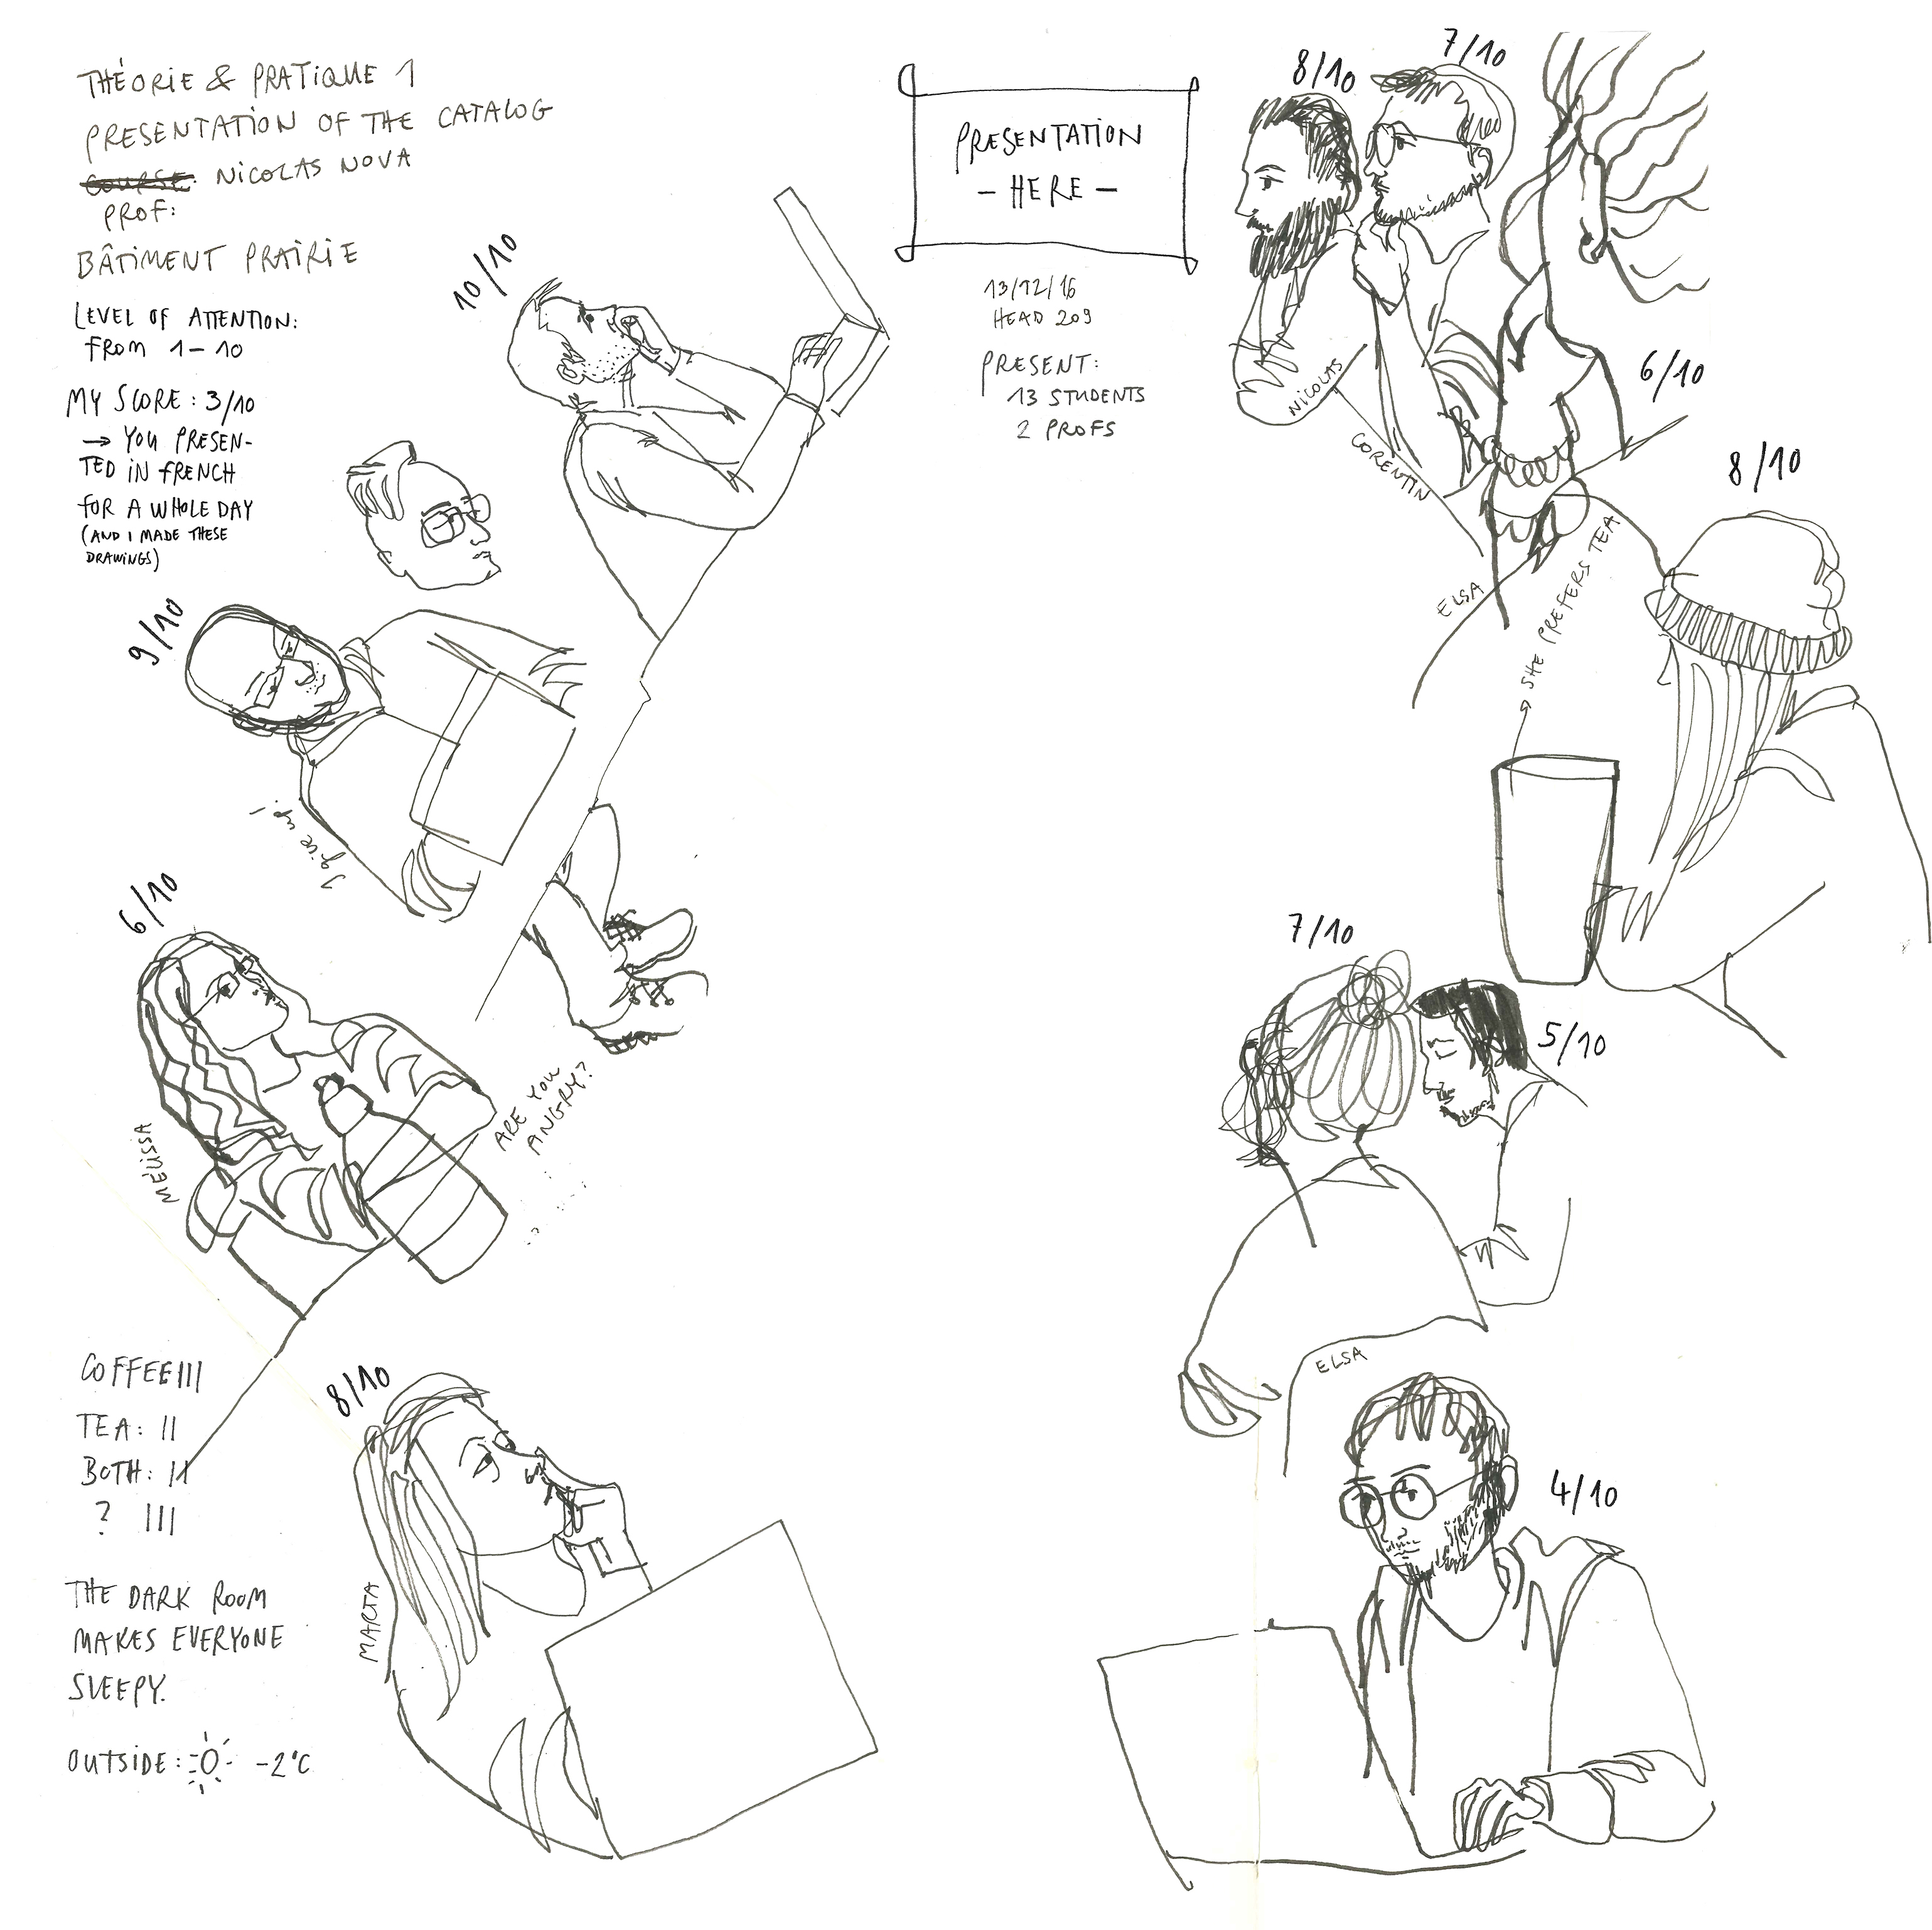
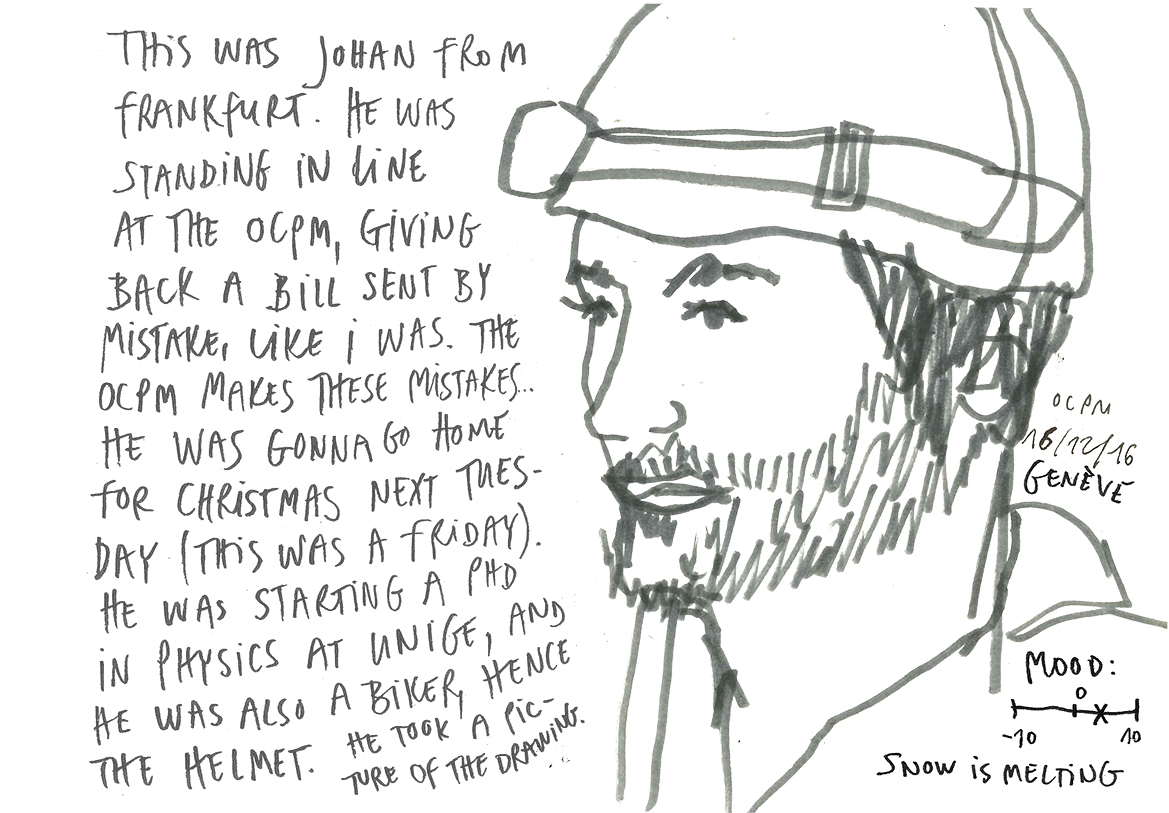
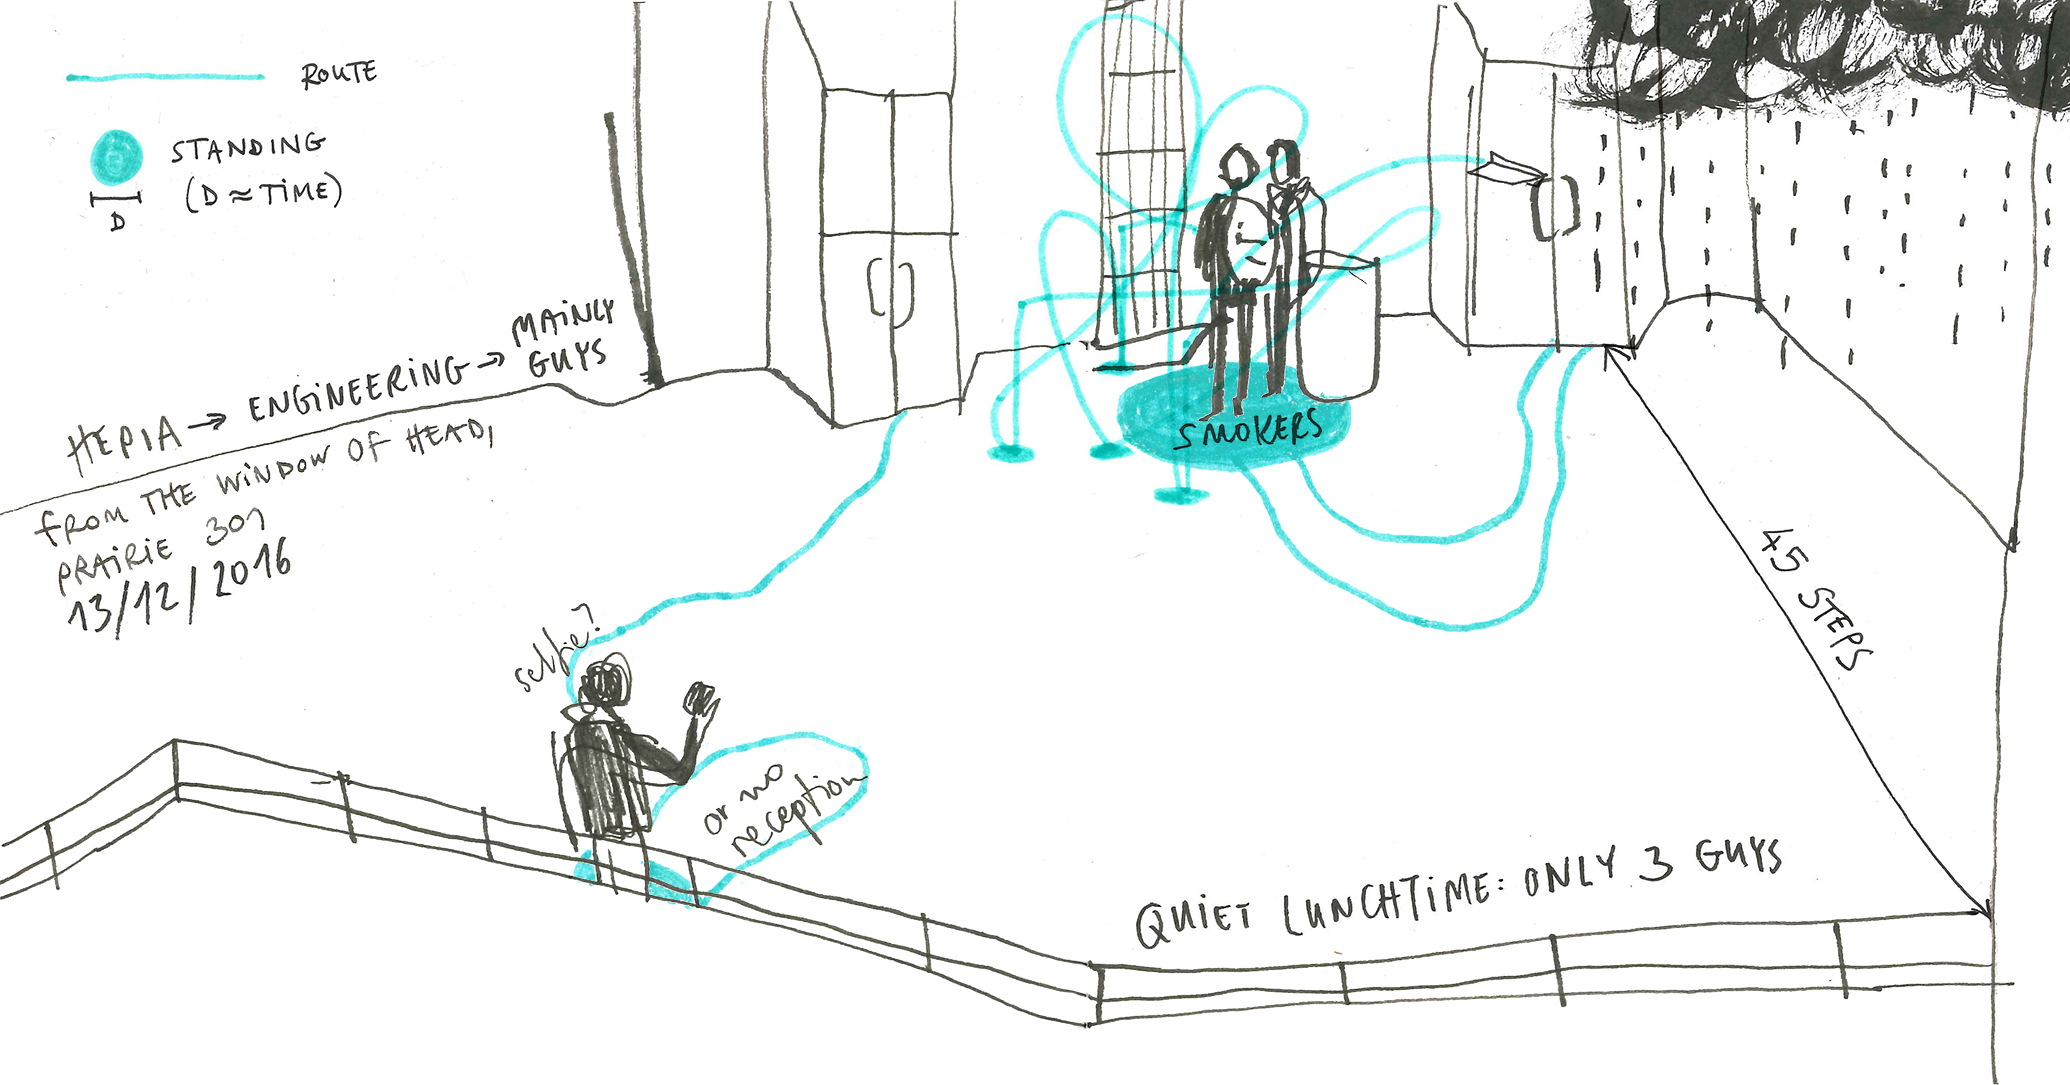
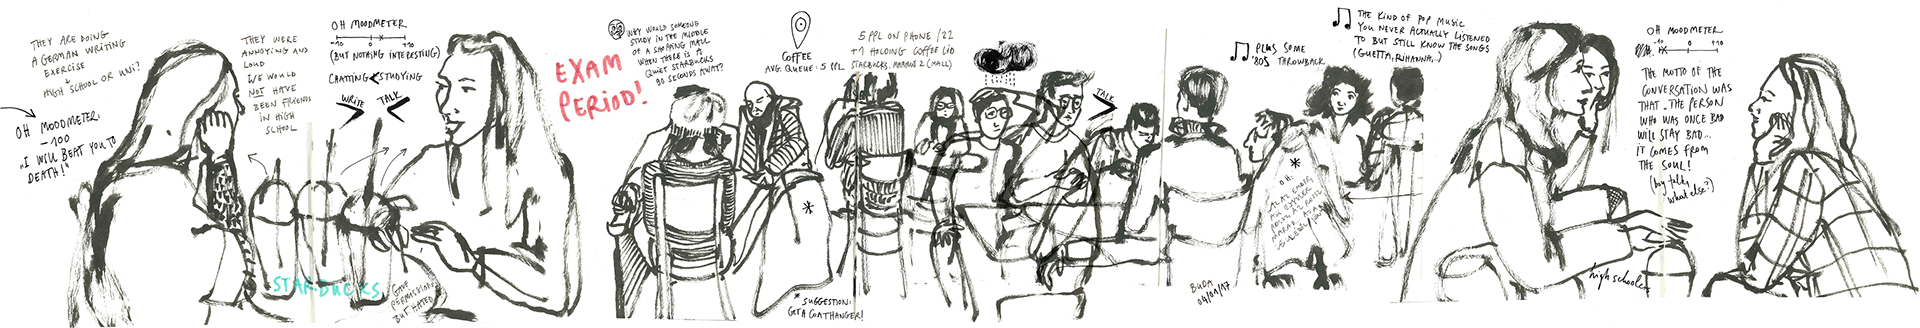
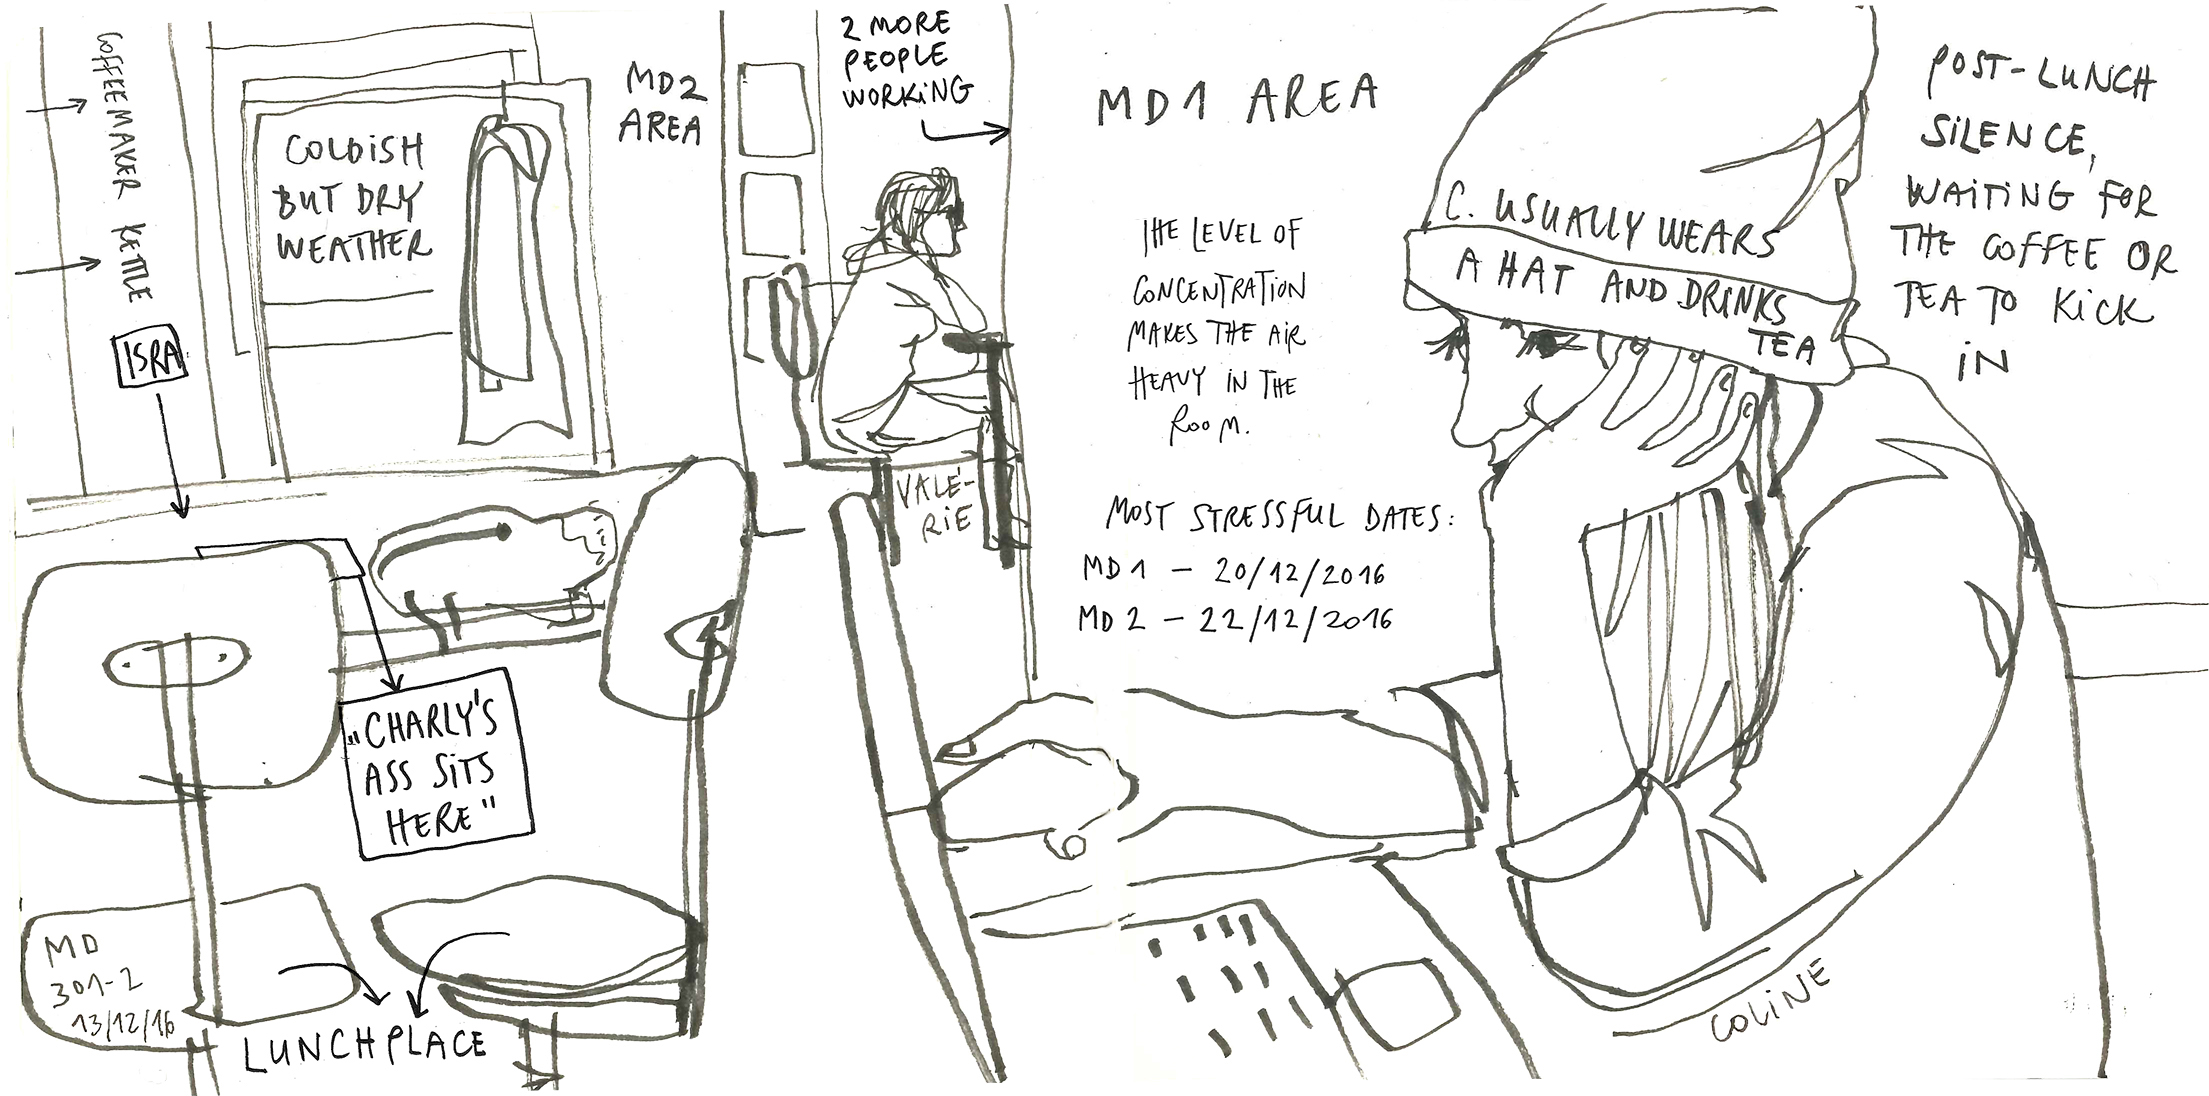
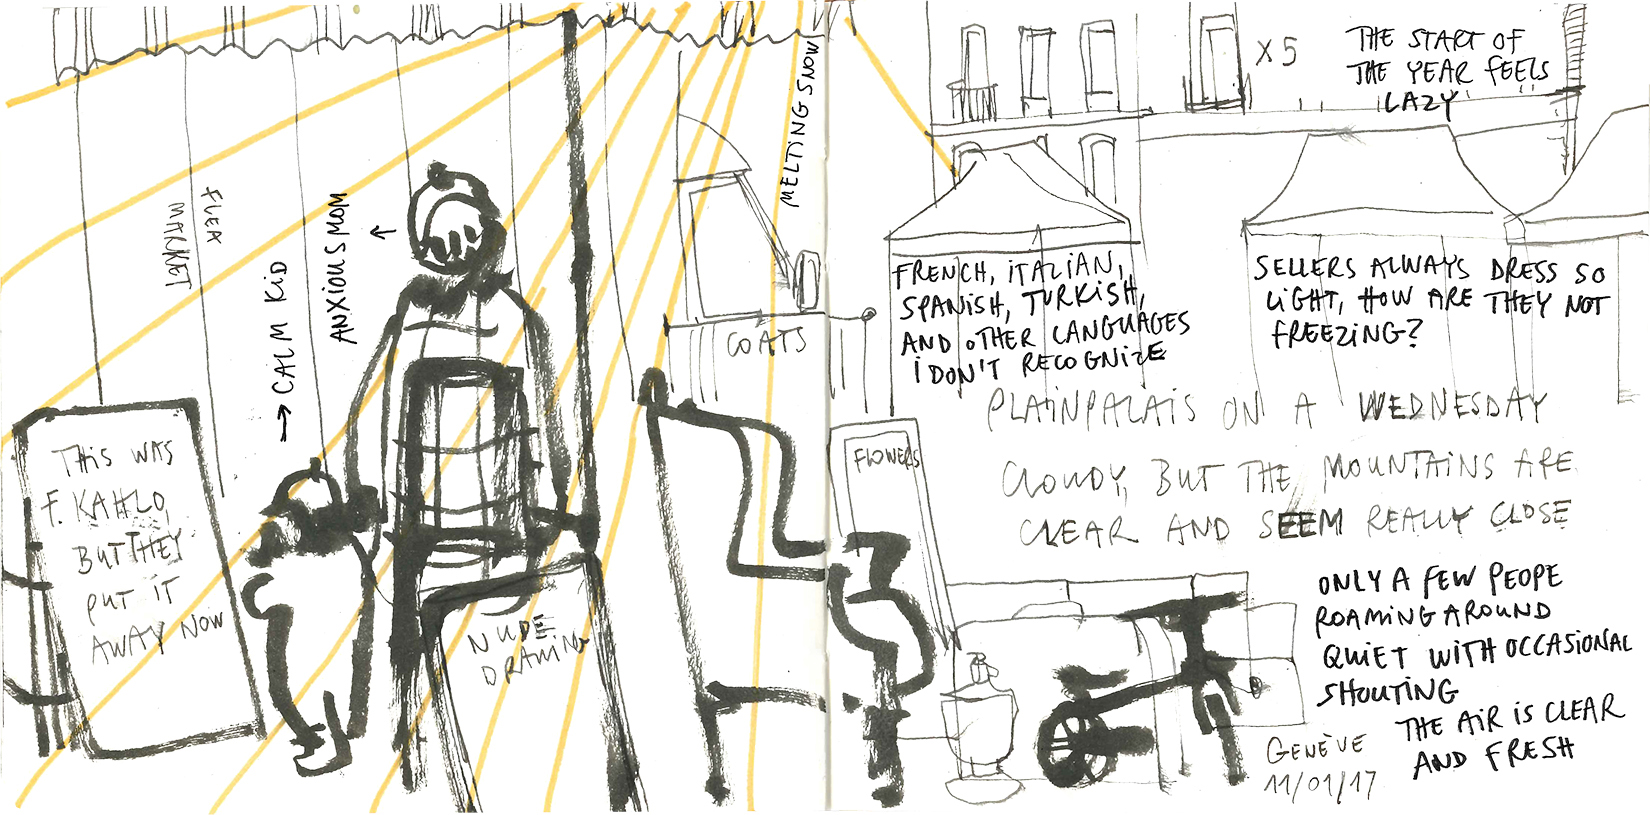
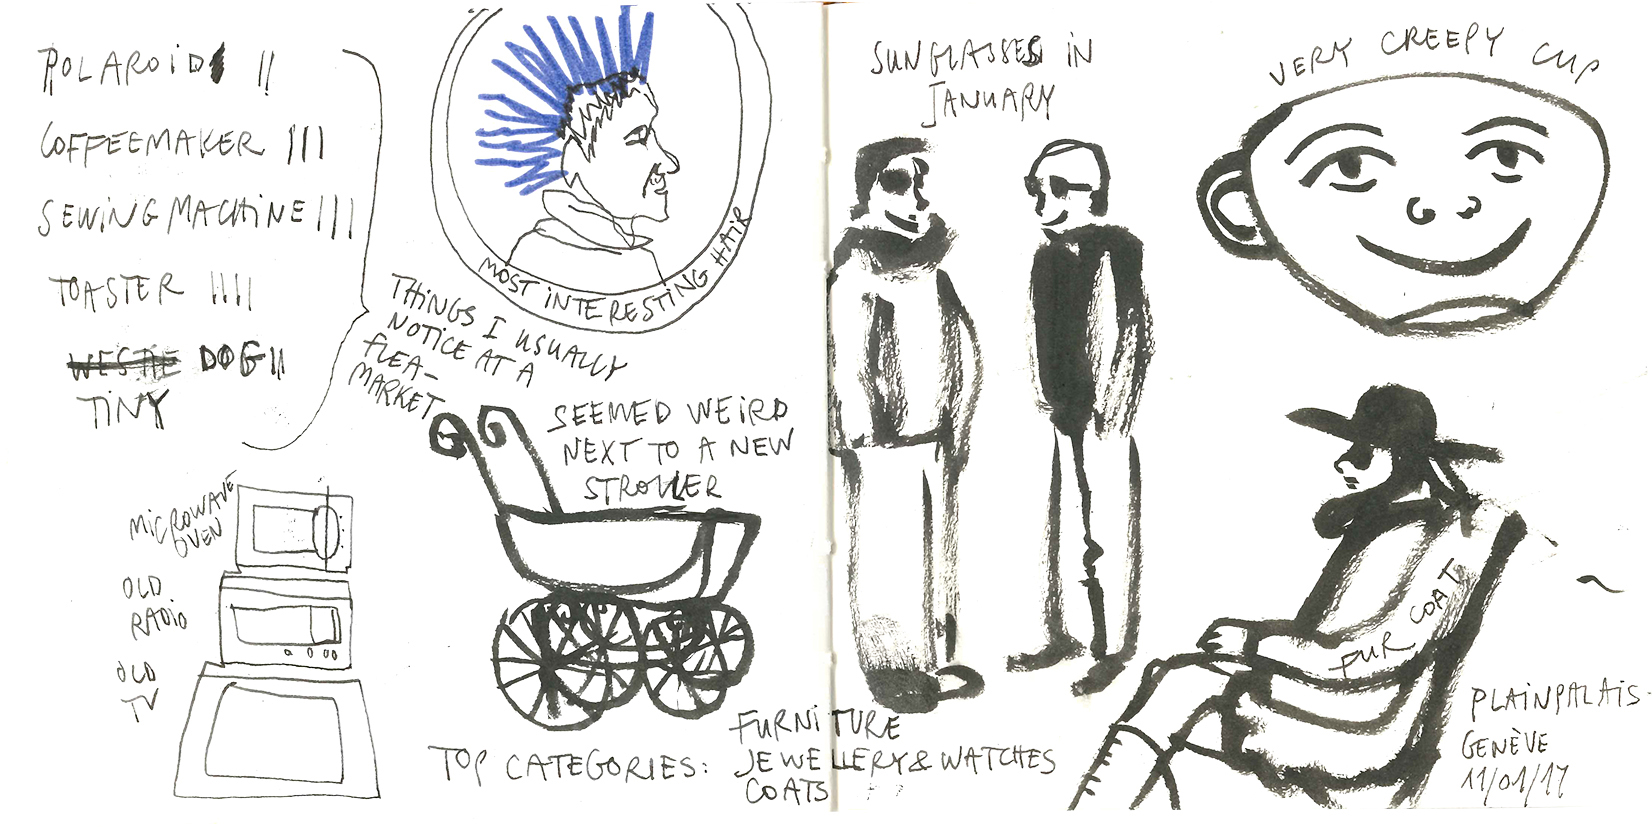
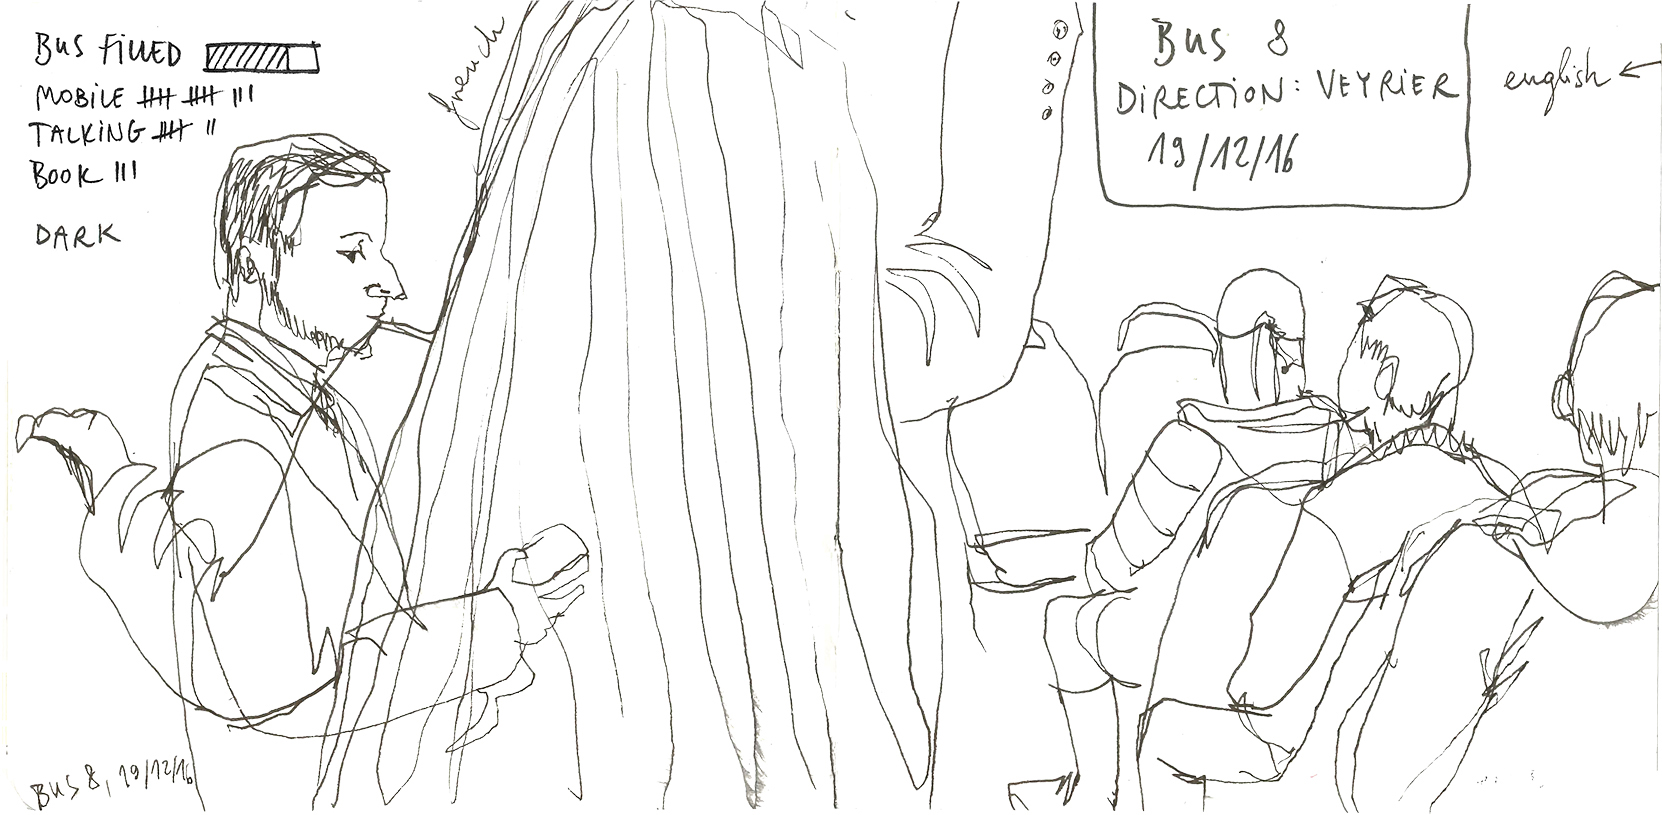
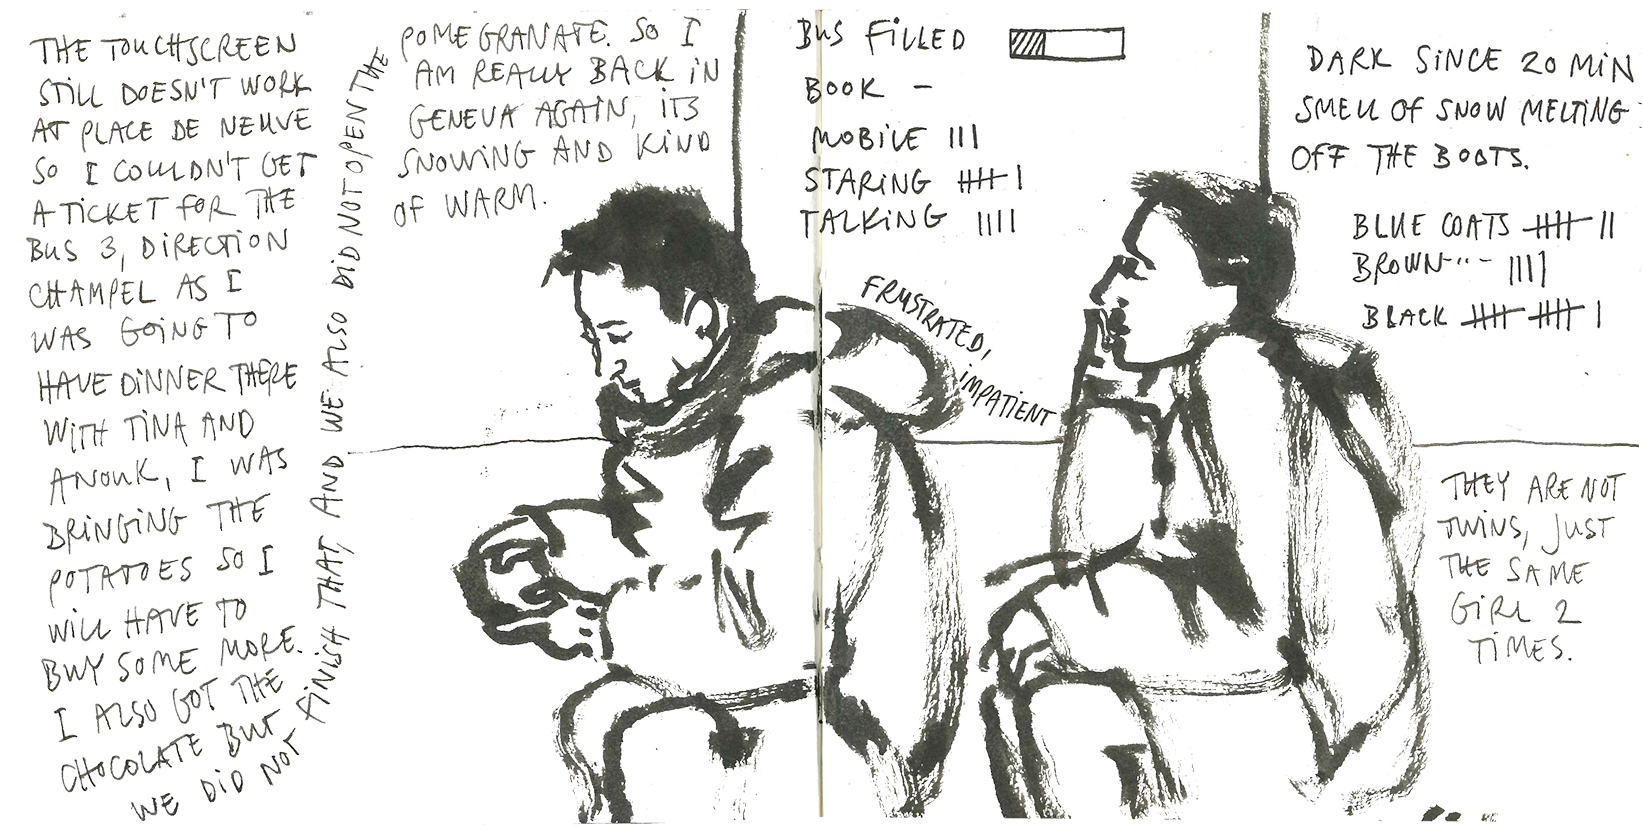
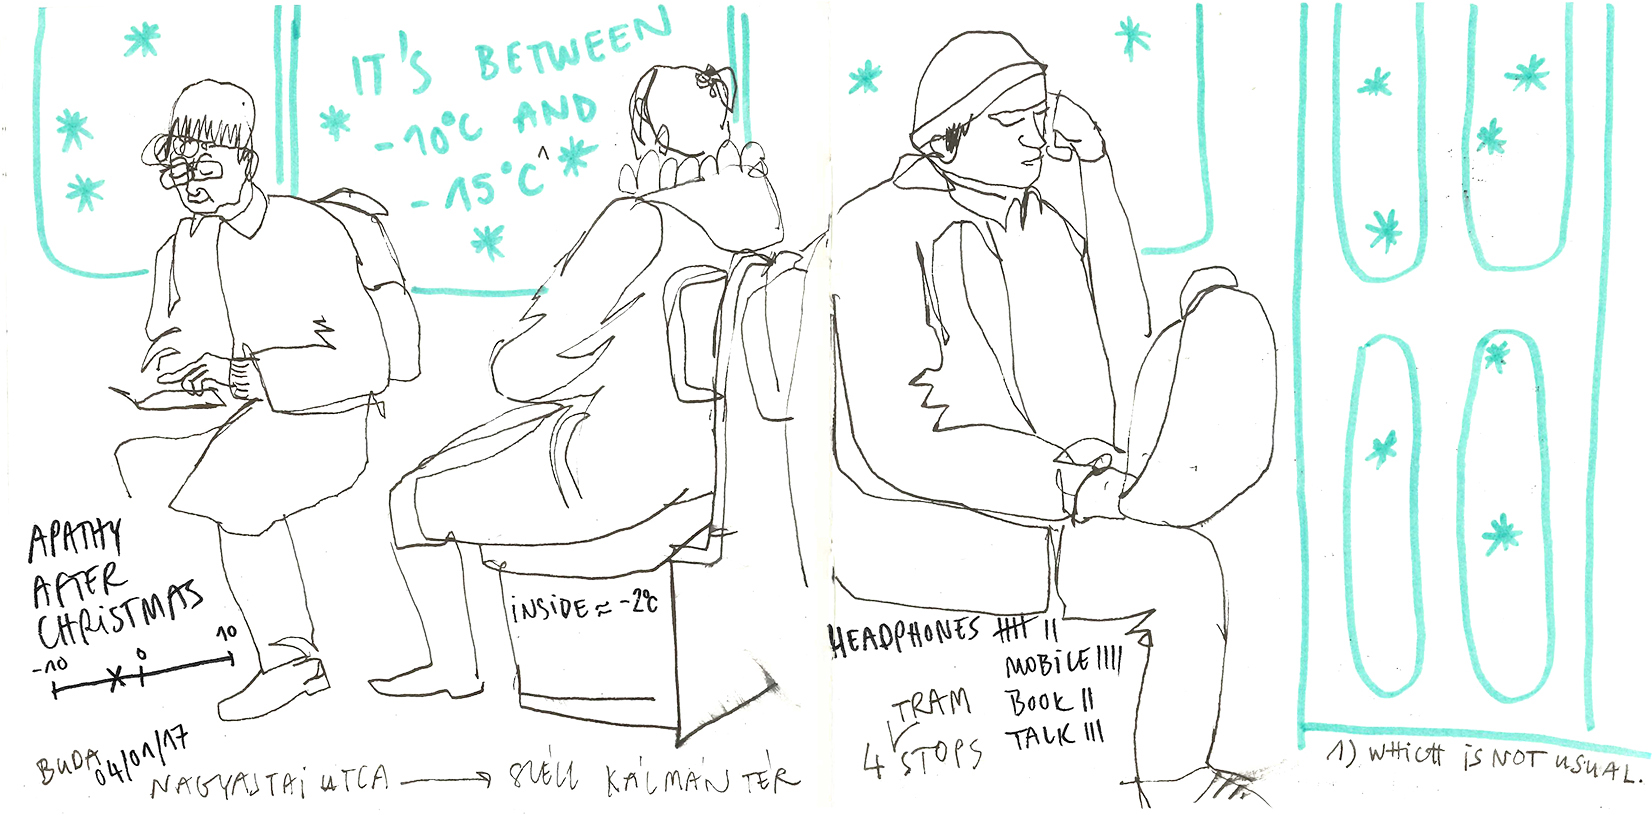
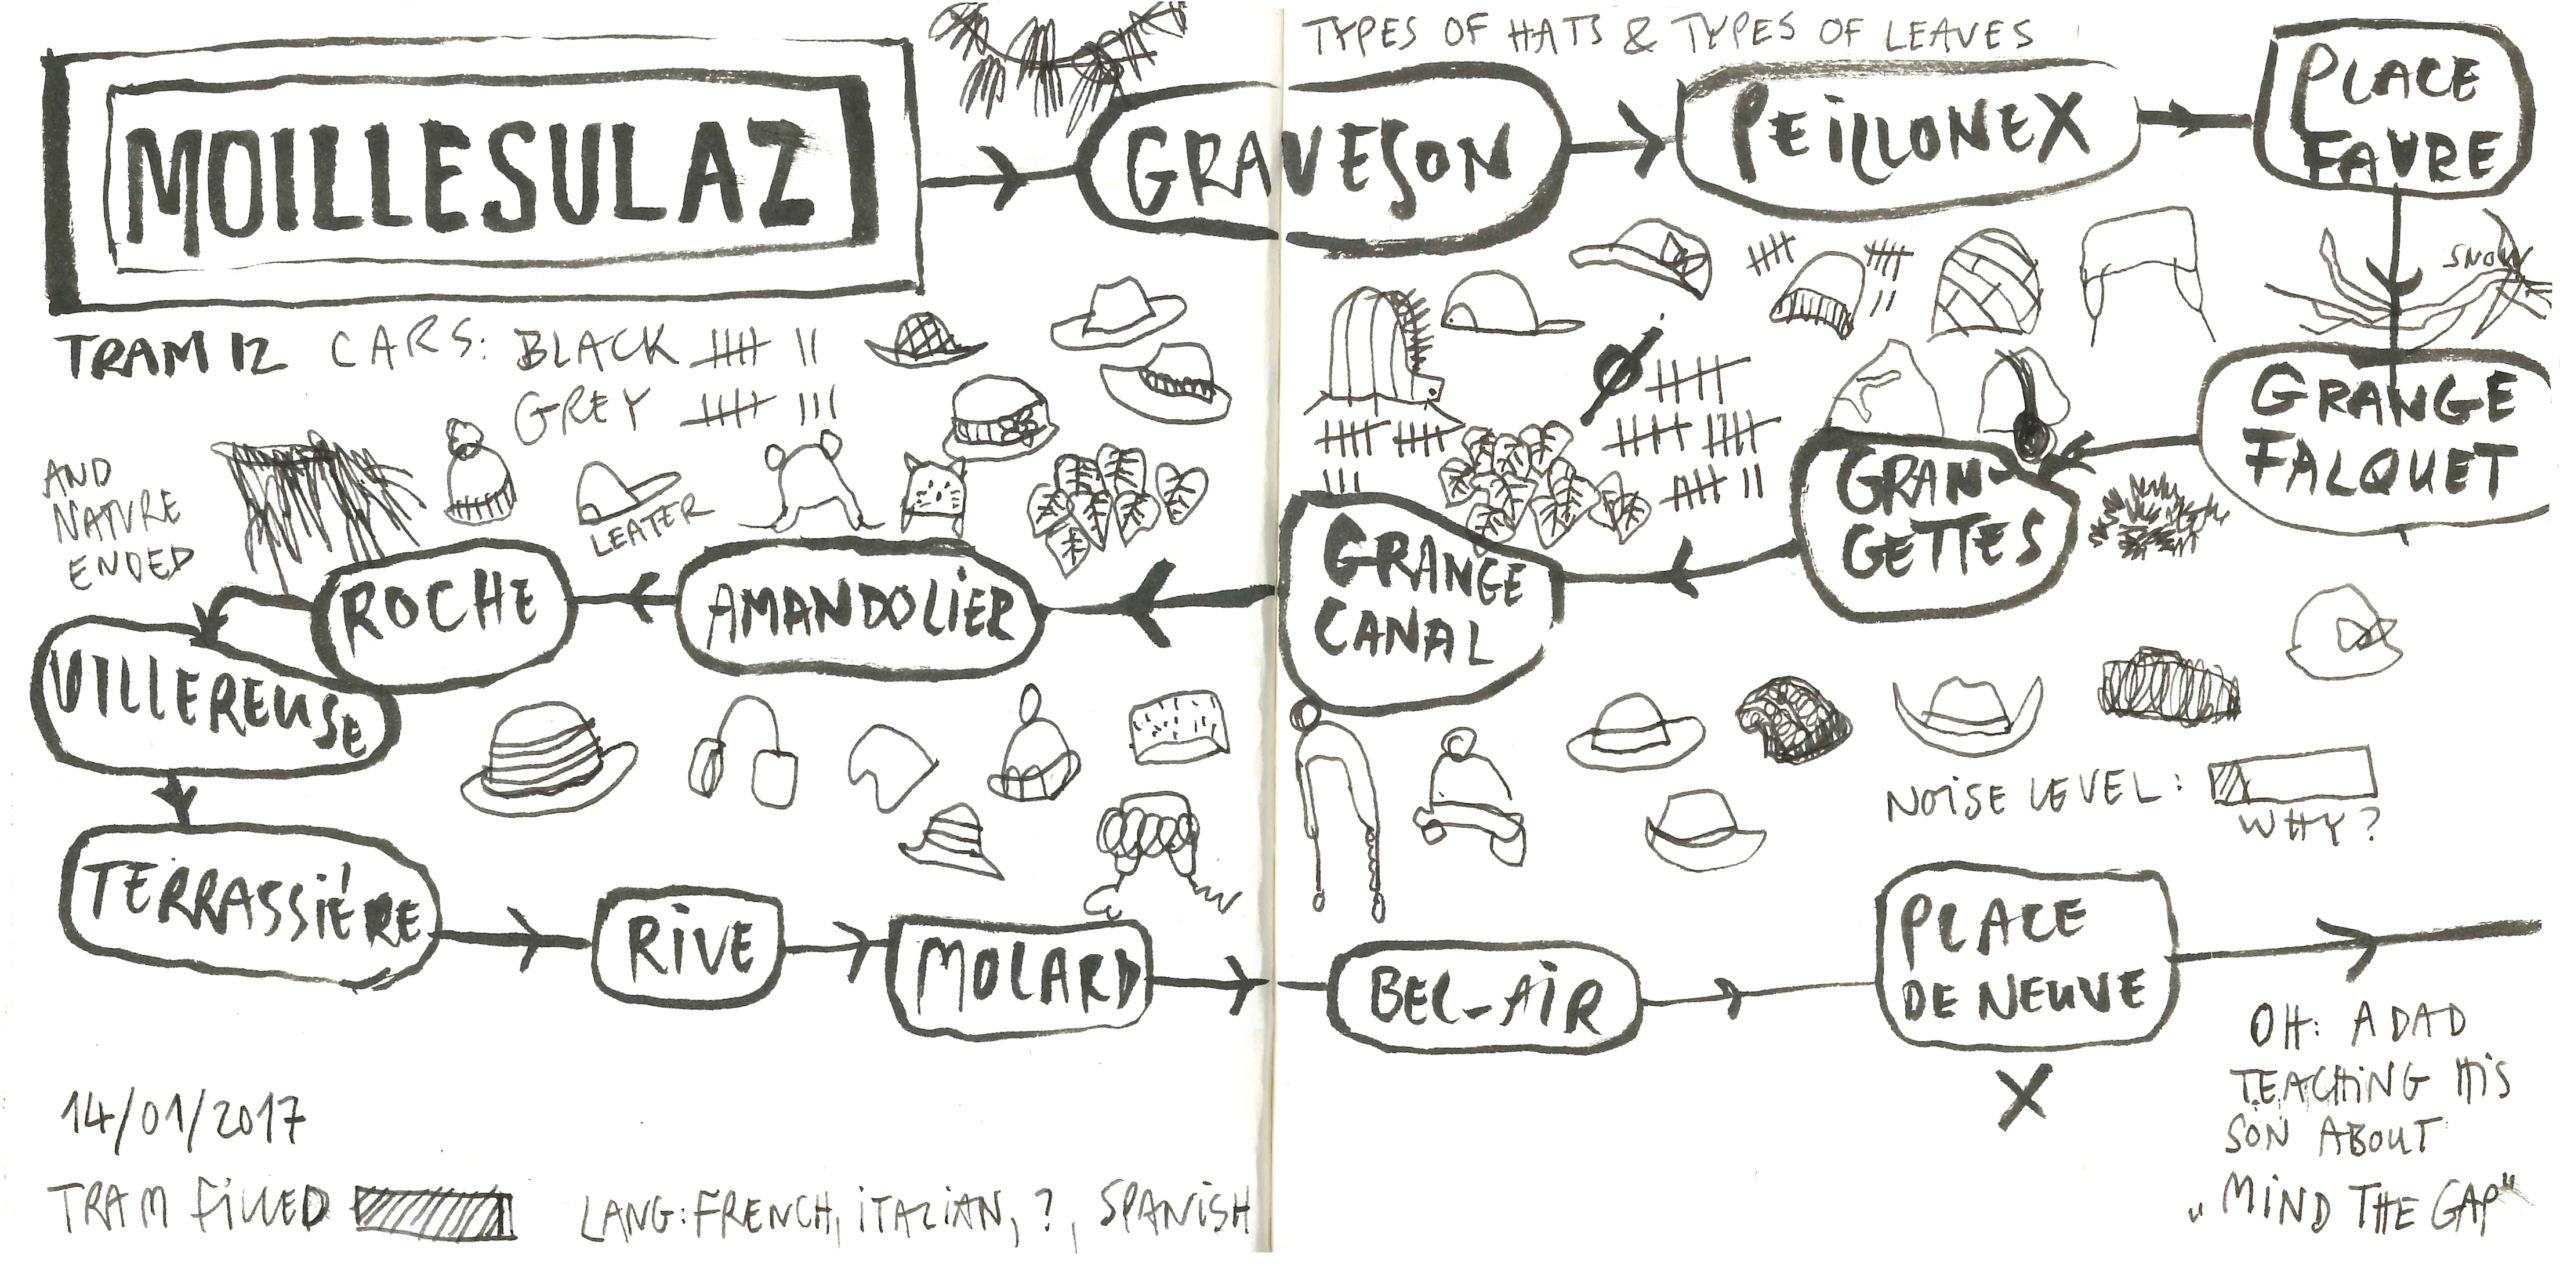
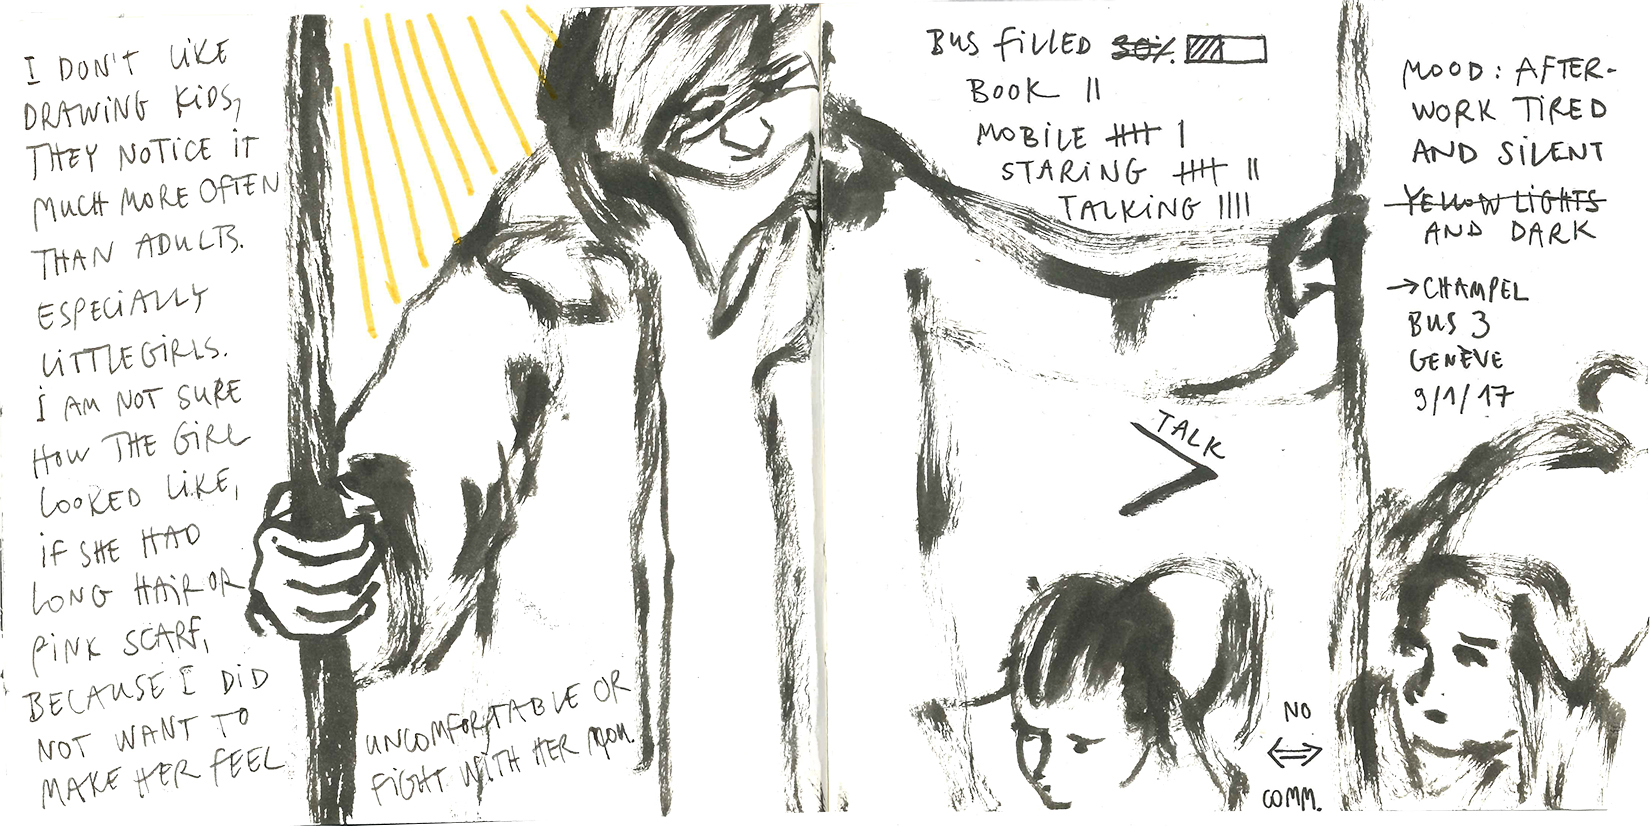
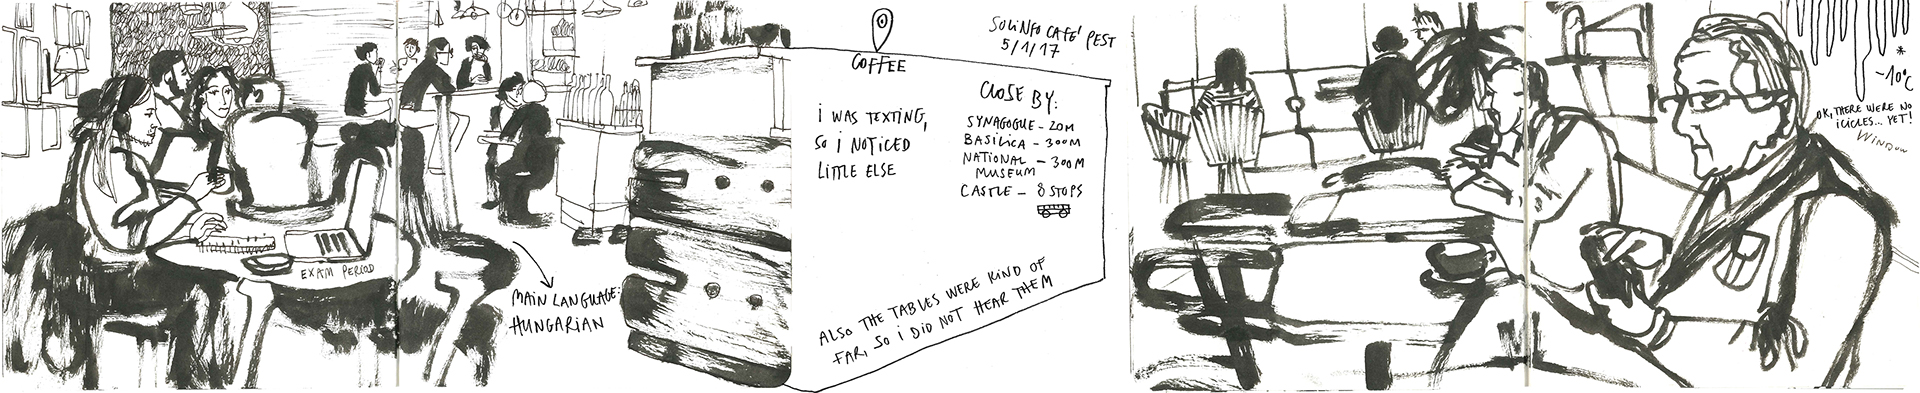
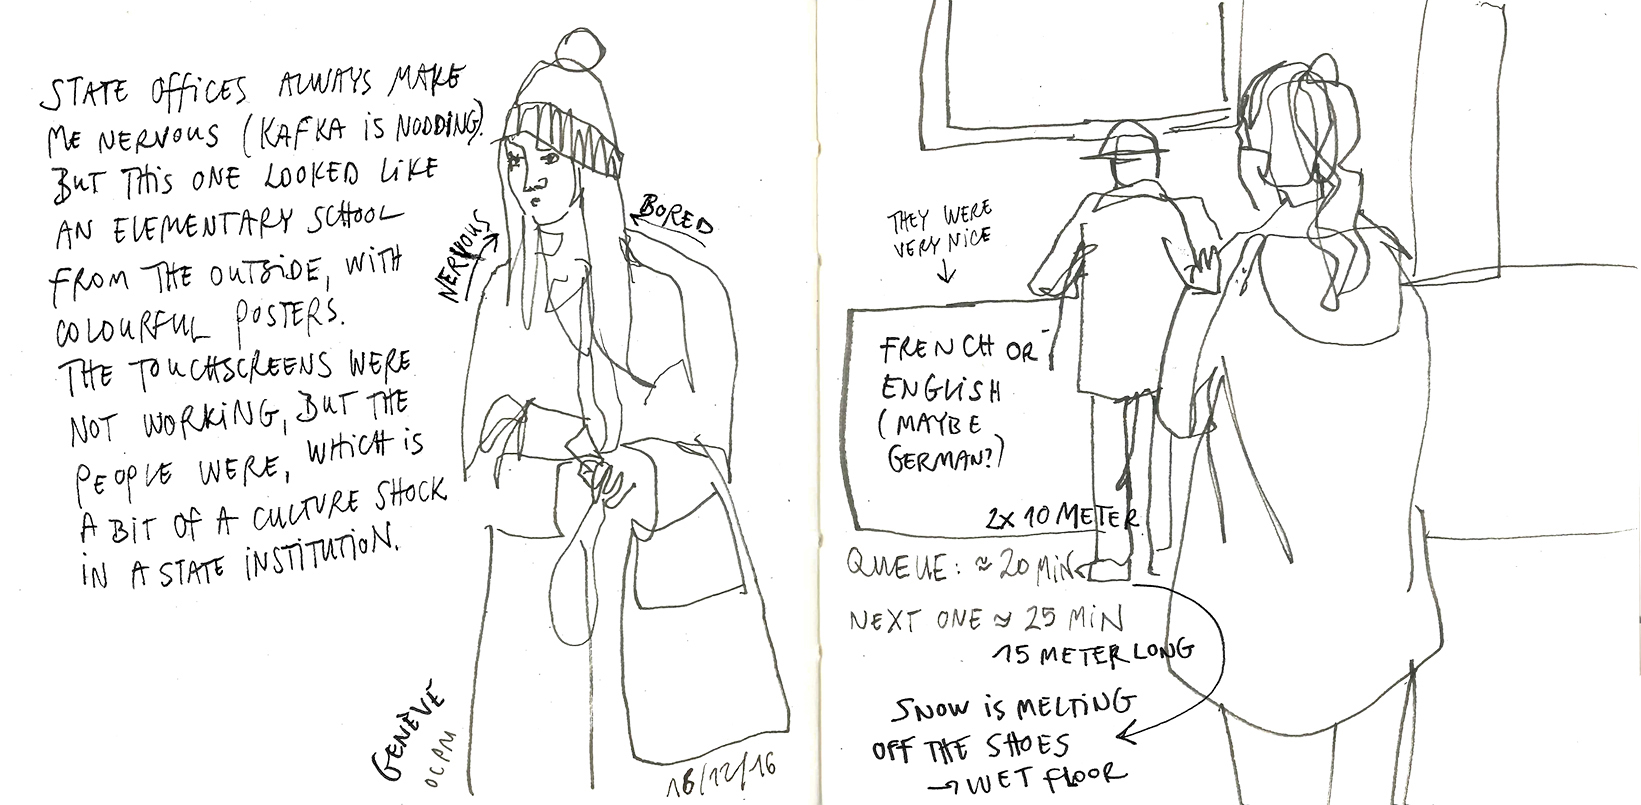
The topic of data usually means different technologies capturing and analyzing information. I wanted to explore an alternative, more organic way of data collection, and having drawn quick sketches on the go for years, it felt as a natural approach of recording. So I began noting down other data next to the usual sketches: the weather, the general mood, connections, overheard conversations, how full was the bus, stories told by friends or strangers and other pieces of information that create context and would be lost otherwise. Sometimes these were added on spot, sometimes later. What is interesting, what should be noted?
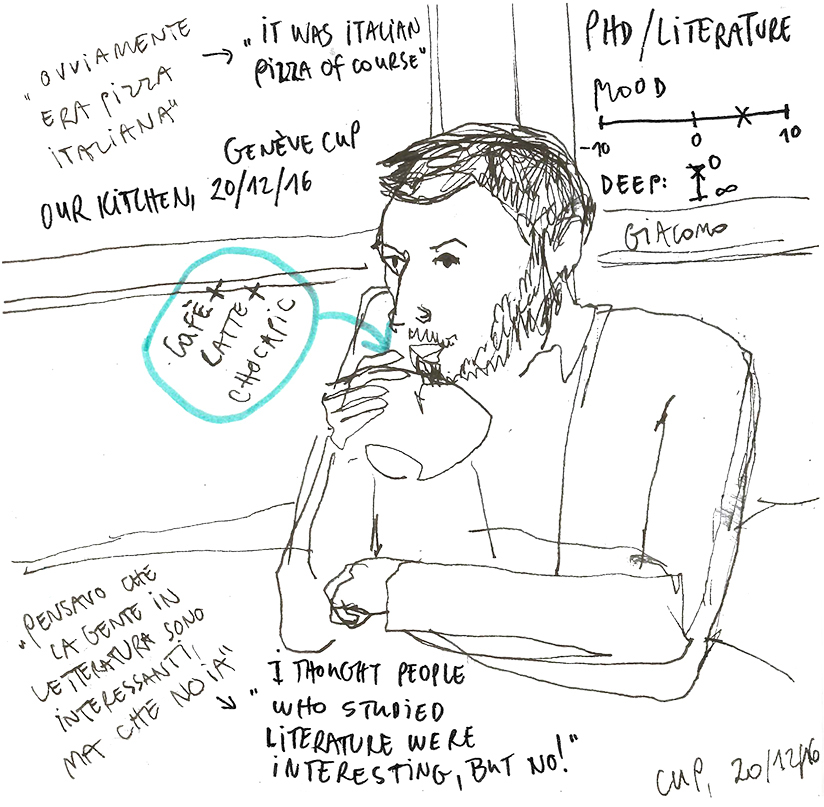
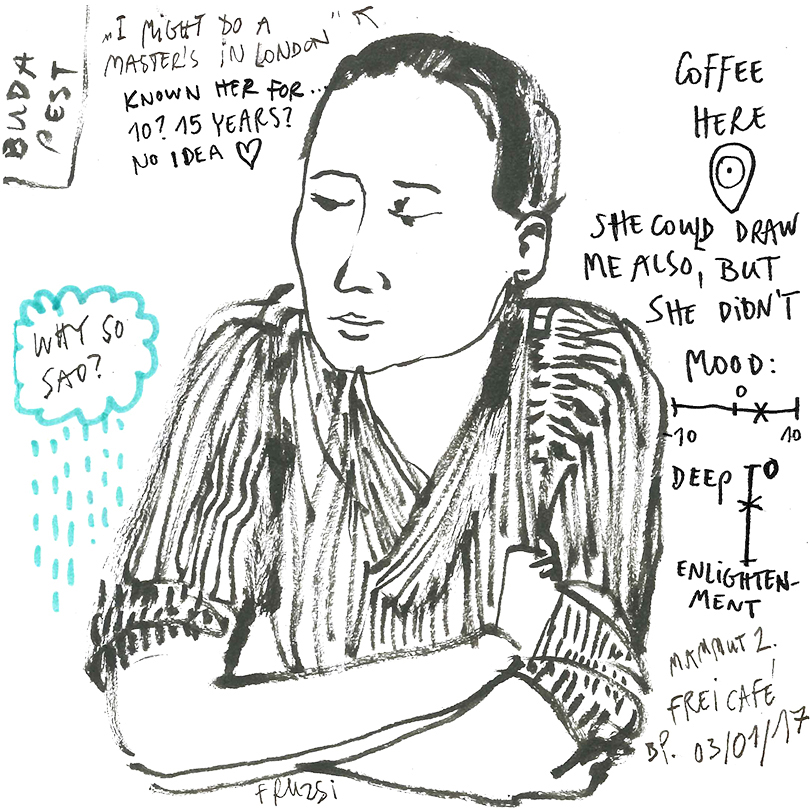
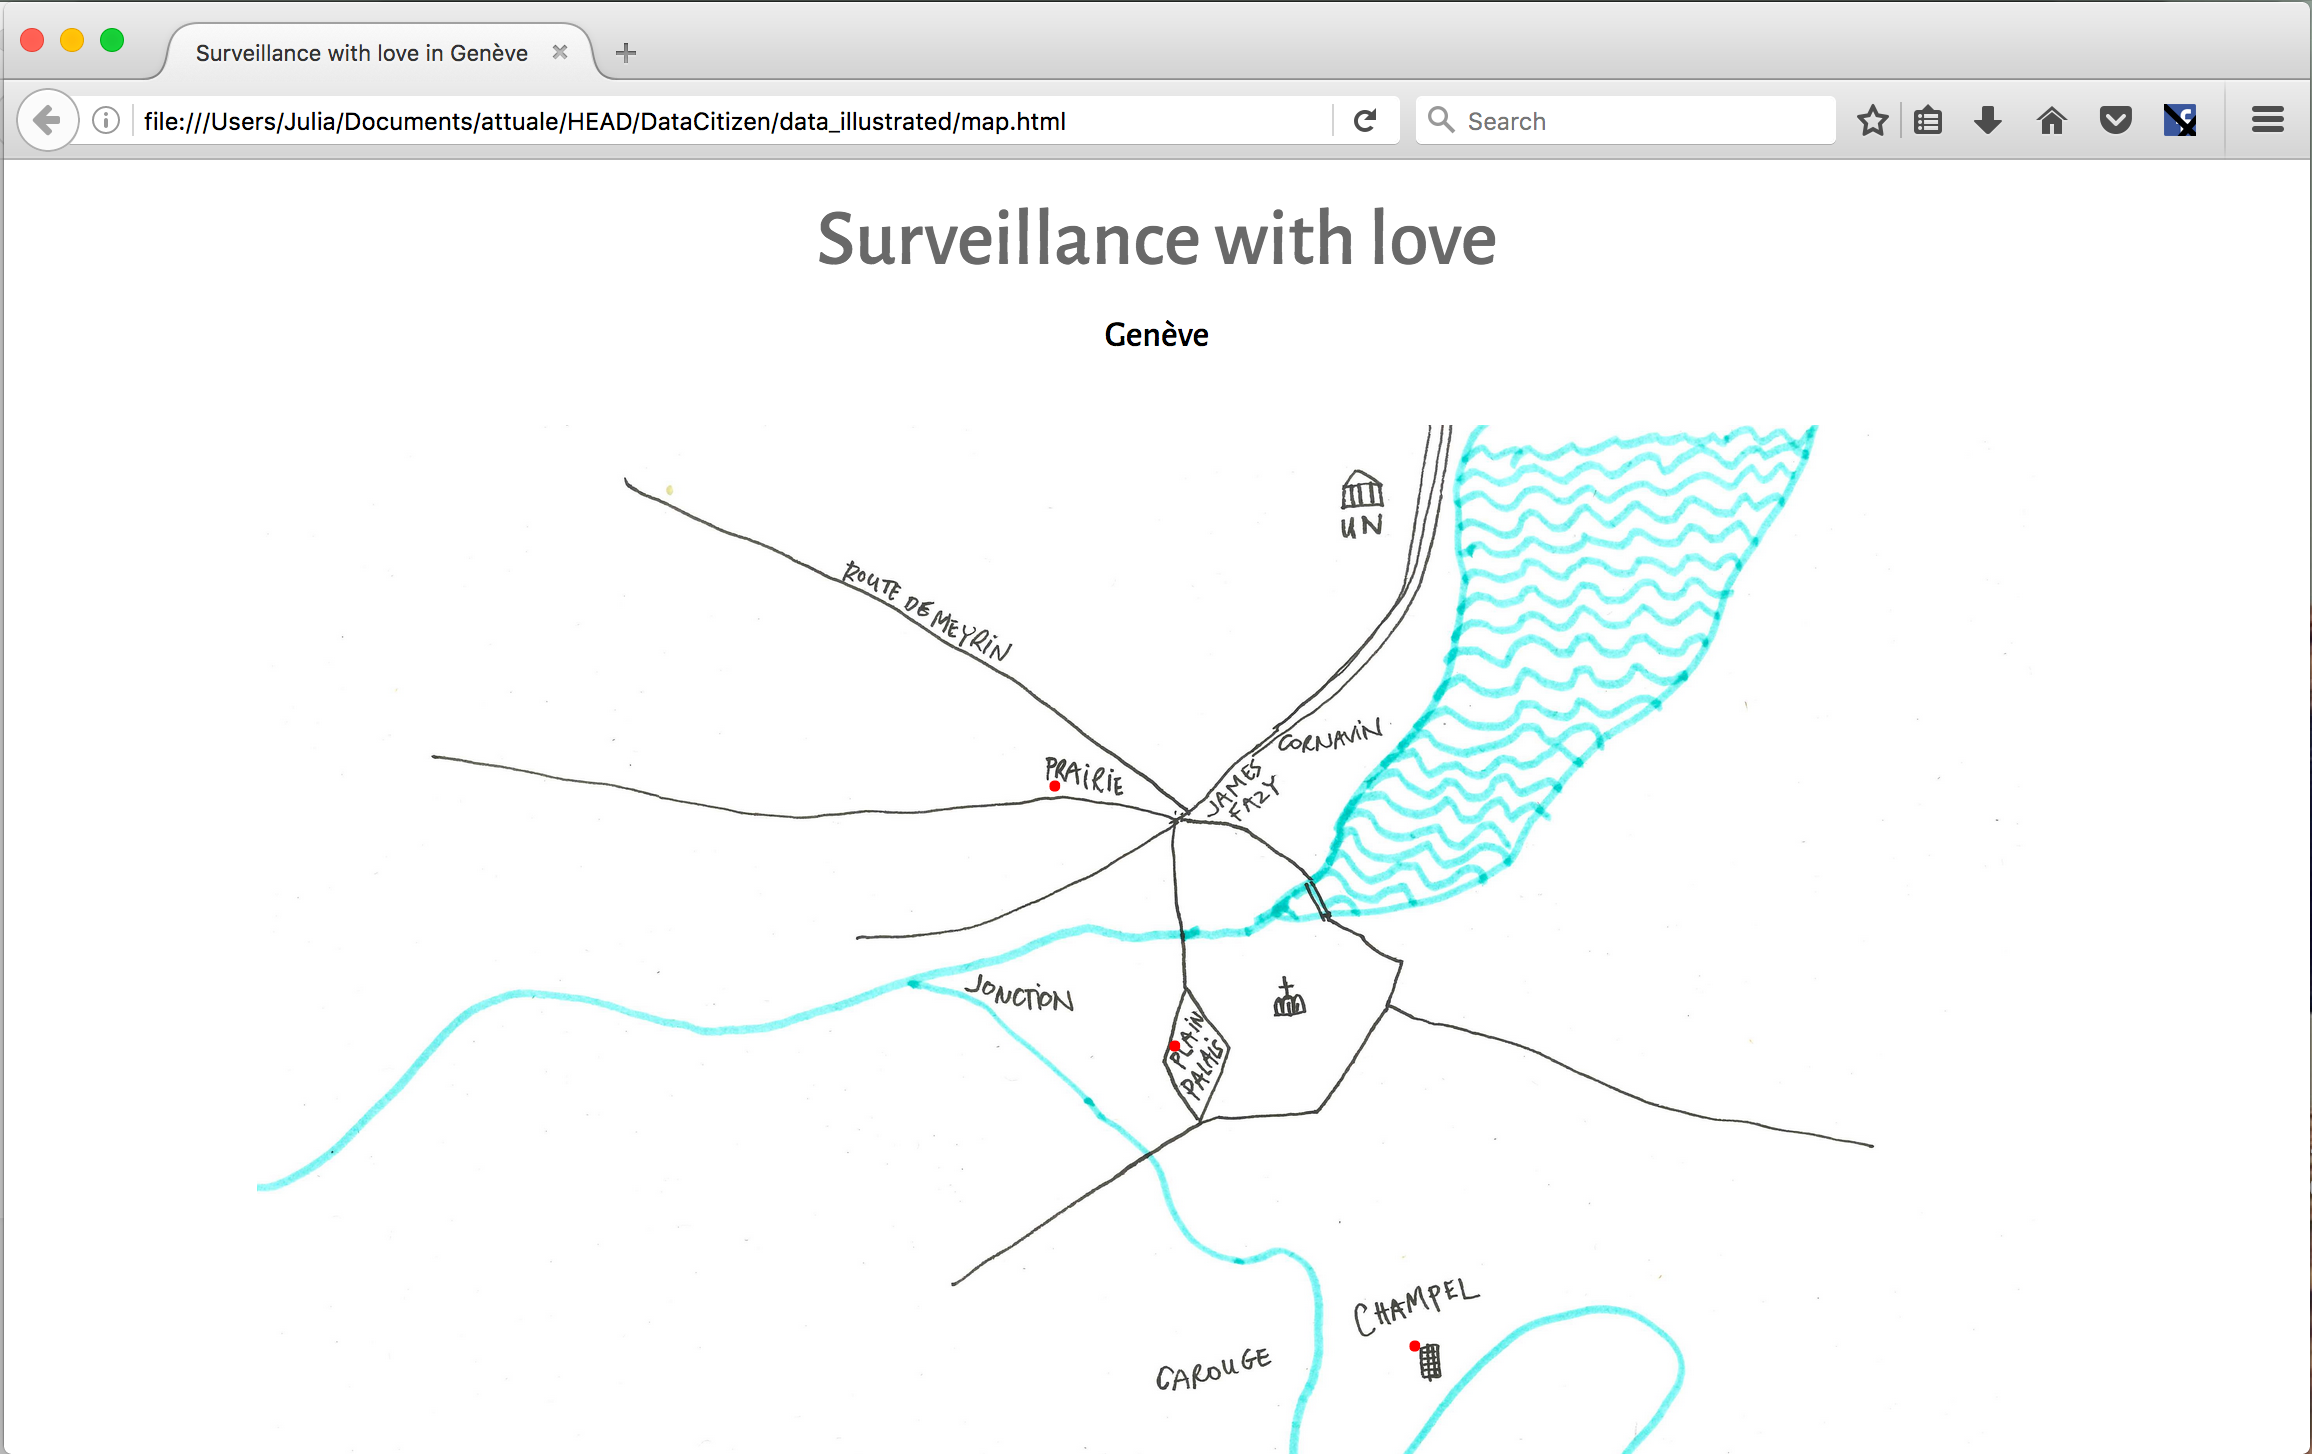
There are layers in each illustration: the visual representation, the ephemeral information and its way of recording that makes it more than just a quick sketch, and the illustrator’s choice for relevant data and visual style. I made sketches with and without permission of its subjects, in coffeehouses, on the bus, in homes, in Genève and in Budapest, sometimes I asked questions and collected stories, other times I stayed in the background. Developing the language through trial and error resulted in a bunch of drawings that I have started to play with. The results include bigger pictures collaged together from drawings of the same place, small series of similar subjects, and a map connecting these images according to their location.
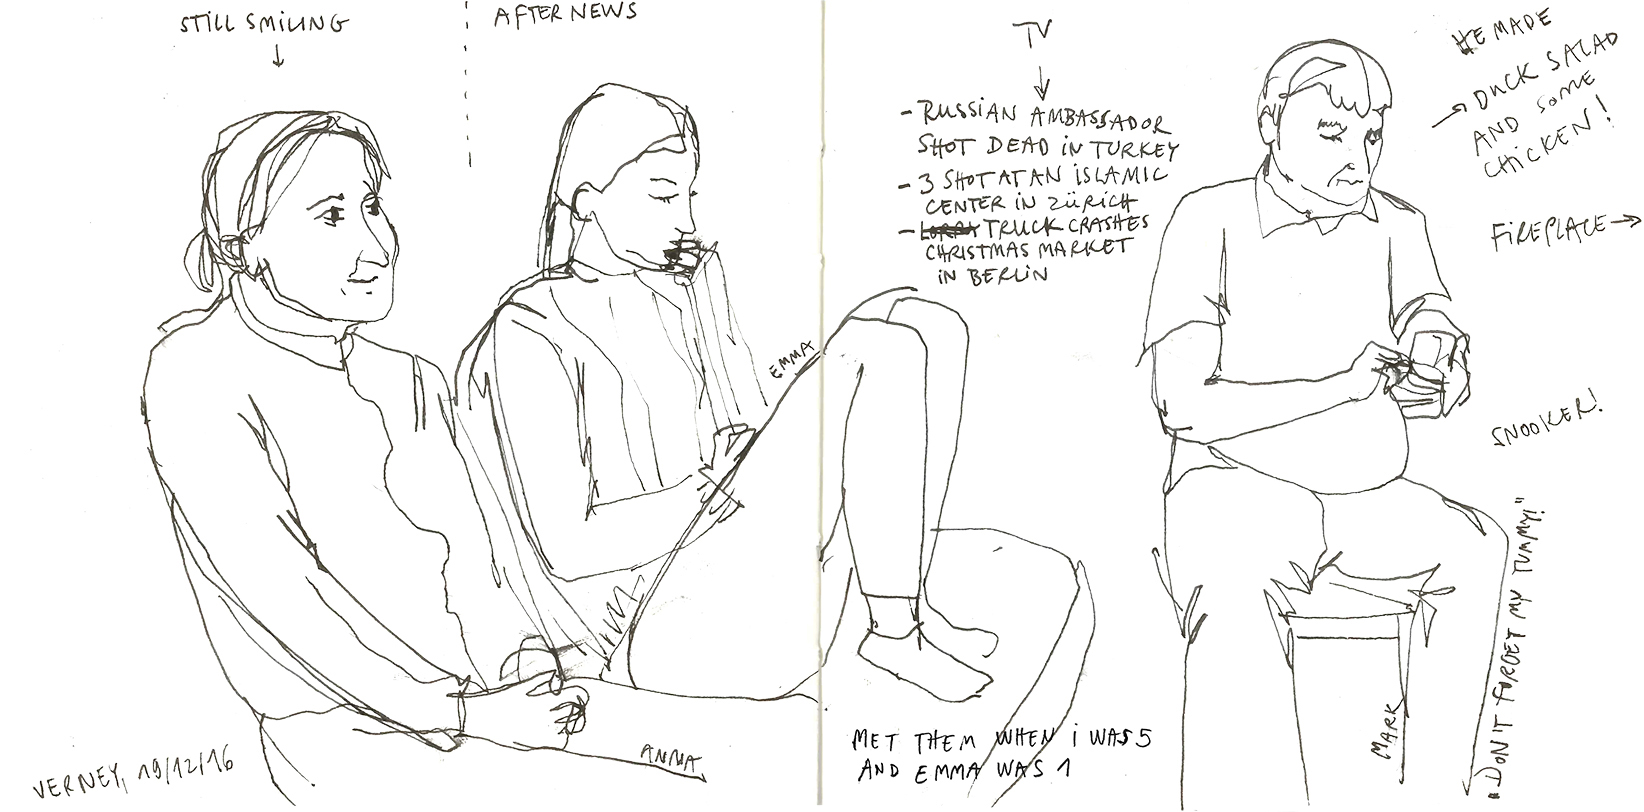
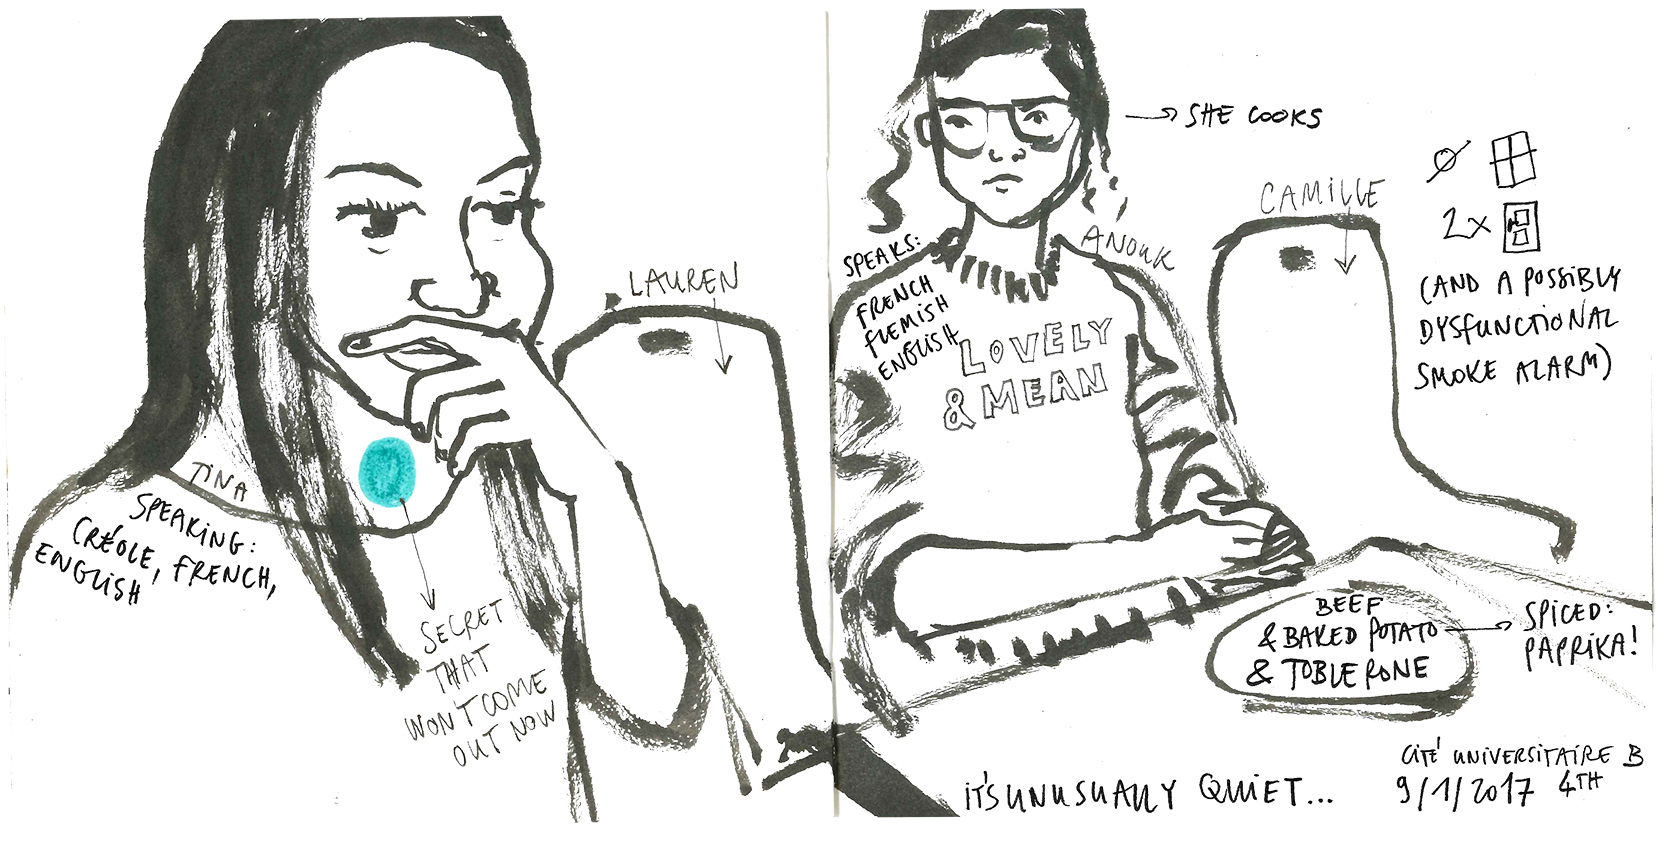
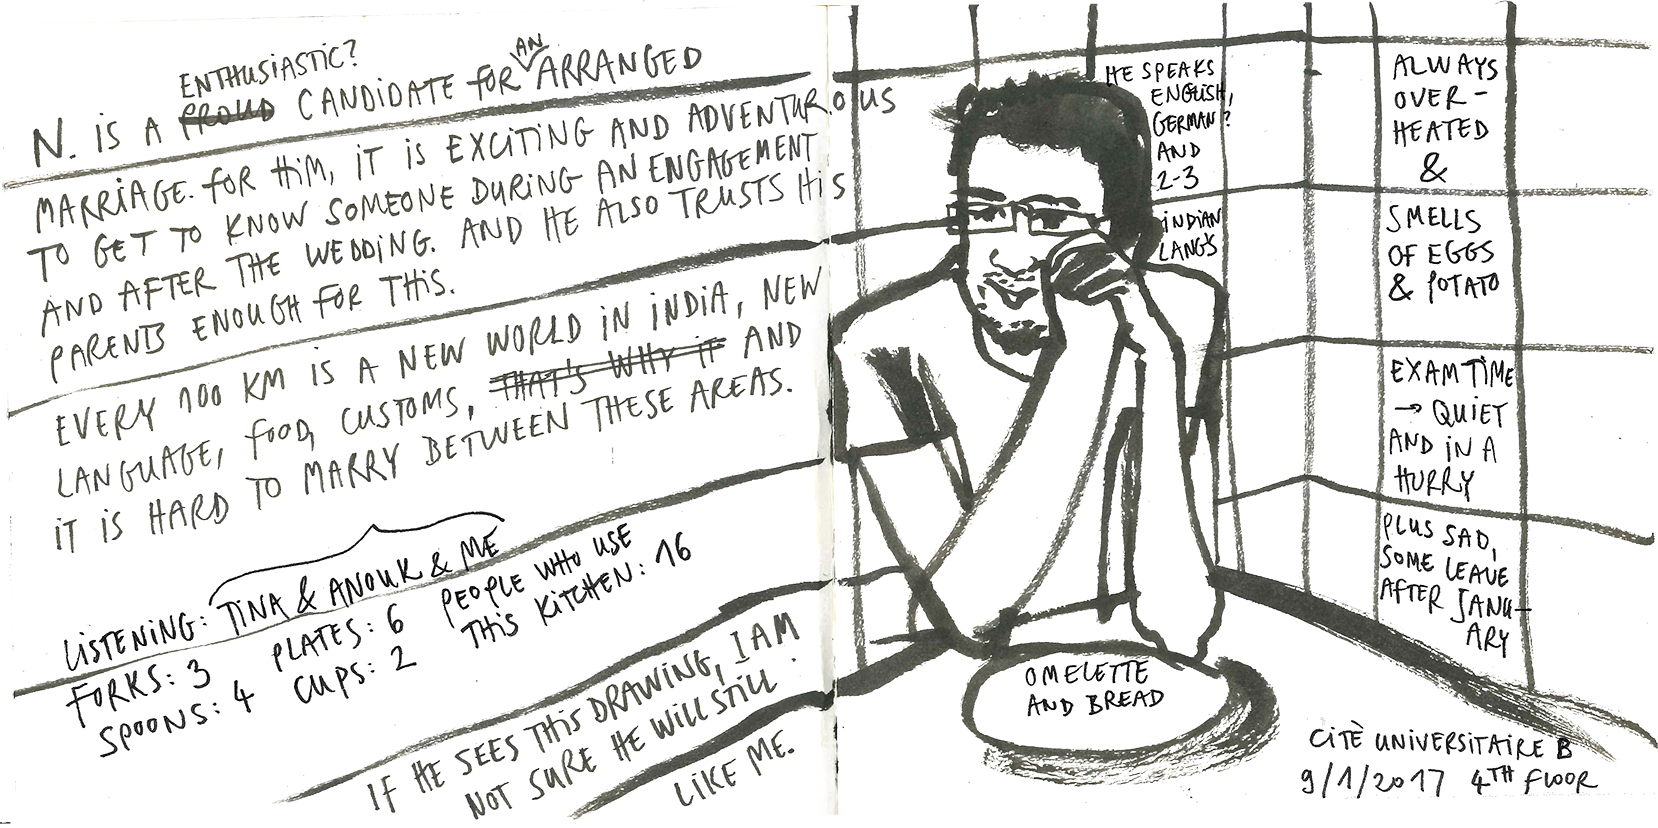
Putting down information by hand can be considered inaccurate and inefficient compared to taking photos or recording big databases. It is slow, personal and subjective. Also drawing can enter into spaces where taking a photo would be uncomfortable, e.g. during breakfast early in the morning, or forbidden, like in a court. While video and photo surveillance always has an air of suspicion and negative connotations, the time and effort put into each drawing focuses more on the appreciation of the captured information. Instead of engineering solutions, illustrations made by one imperfect person are the tools to capture and communicate data, making it human-centered.
As this particular overlap between illustration and data-collection is easiest to develop during creation, and since it has already been a habit for several years, I will continue drawing on the spot. Possible next steps: develop a blog and/or the hand-drawn map that connects my snapshots, and create printed collections or books with some organizing principles (location, theme, date, etc.
HEAD Genève Media Design MA 2017
Tutor: Dominic Robson